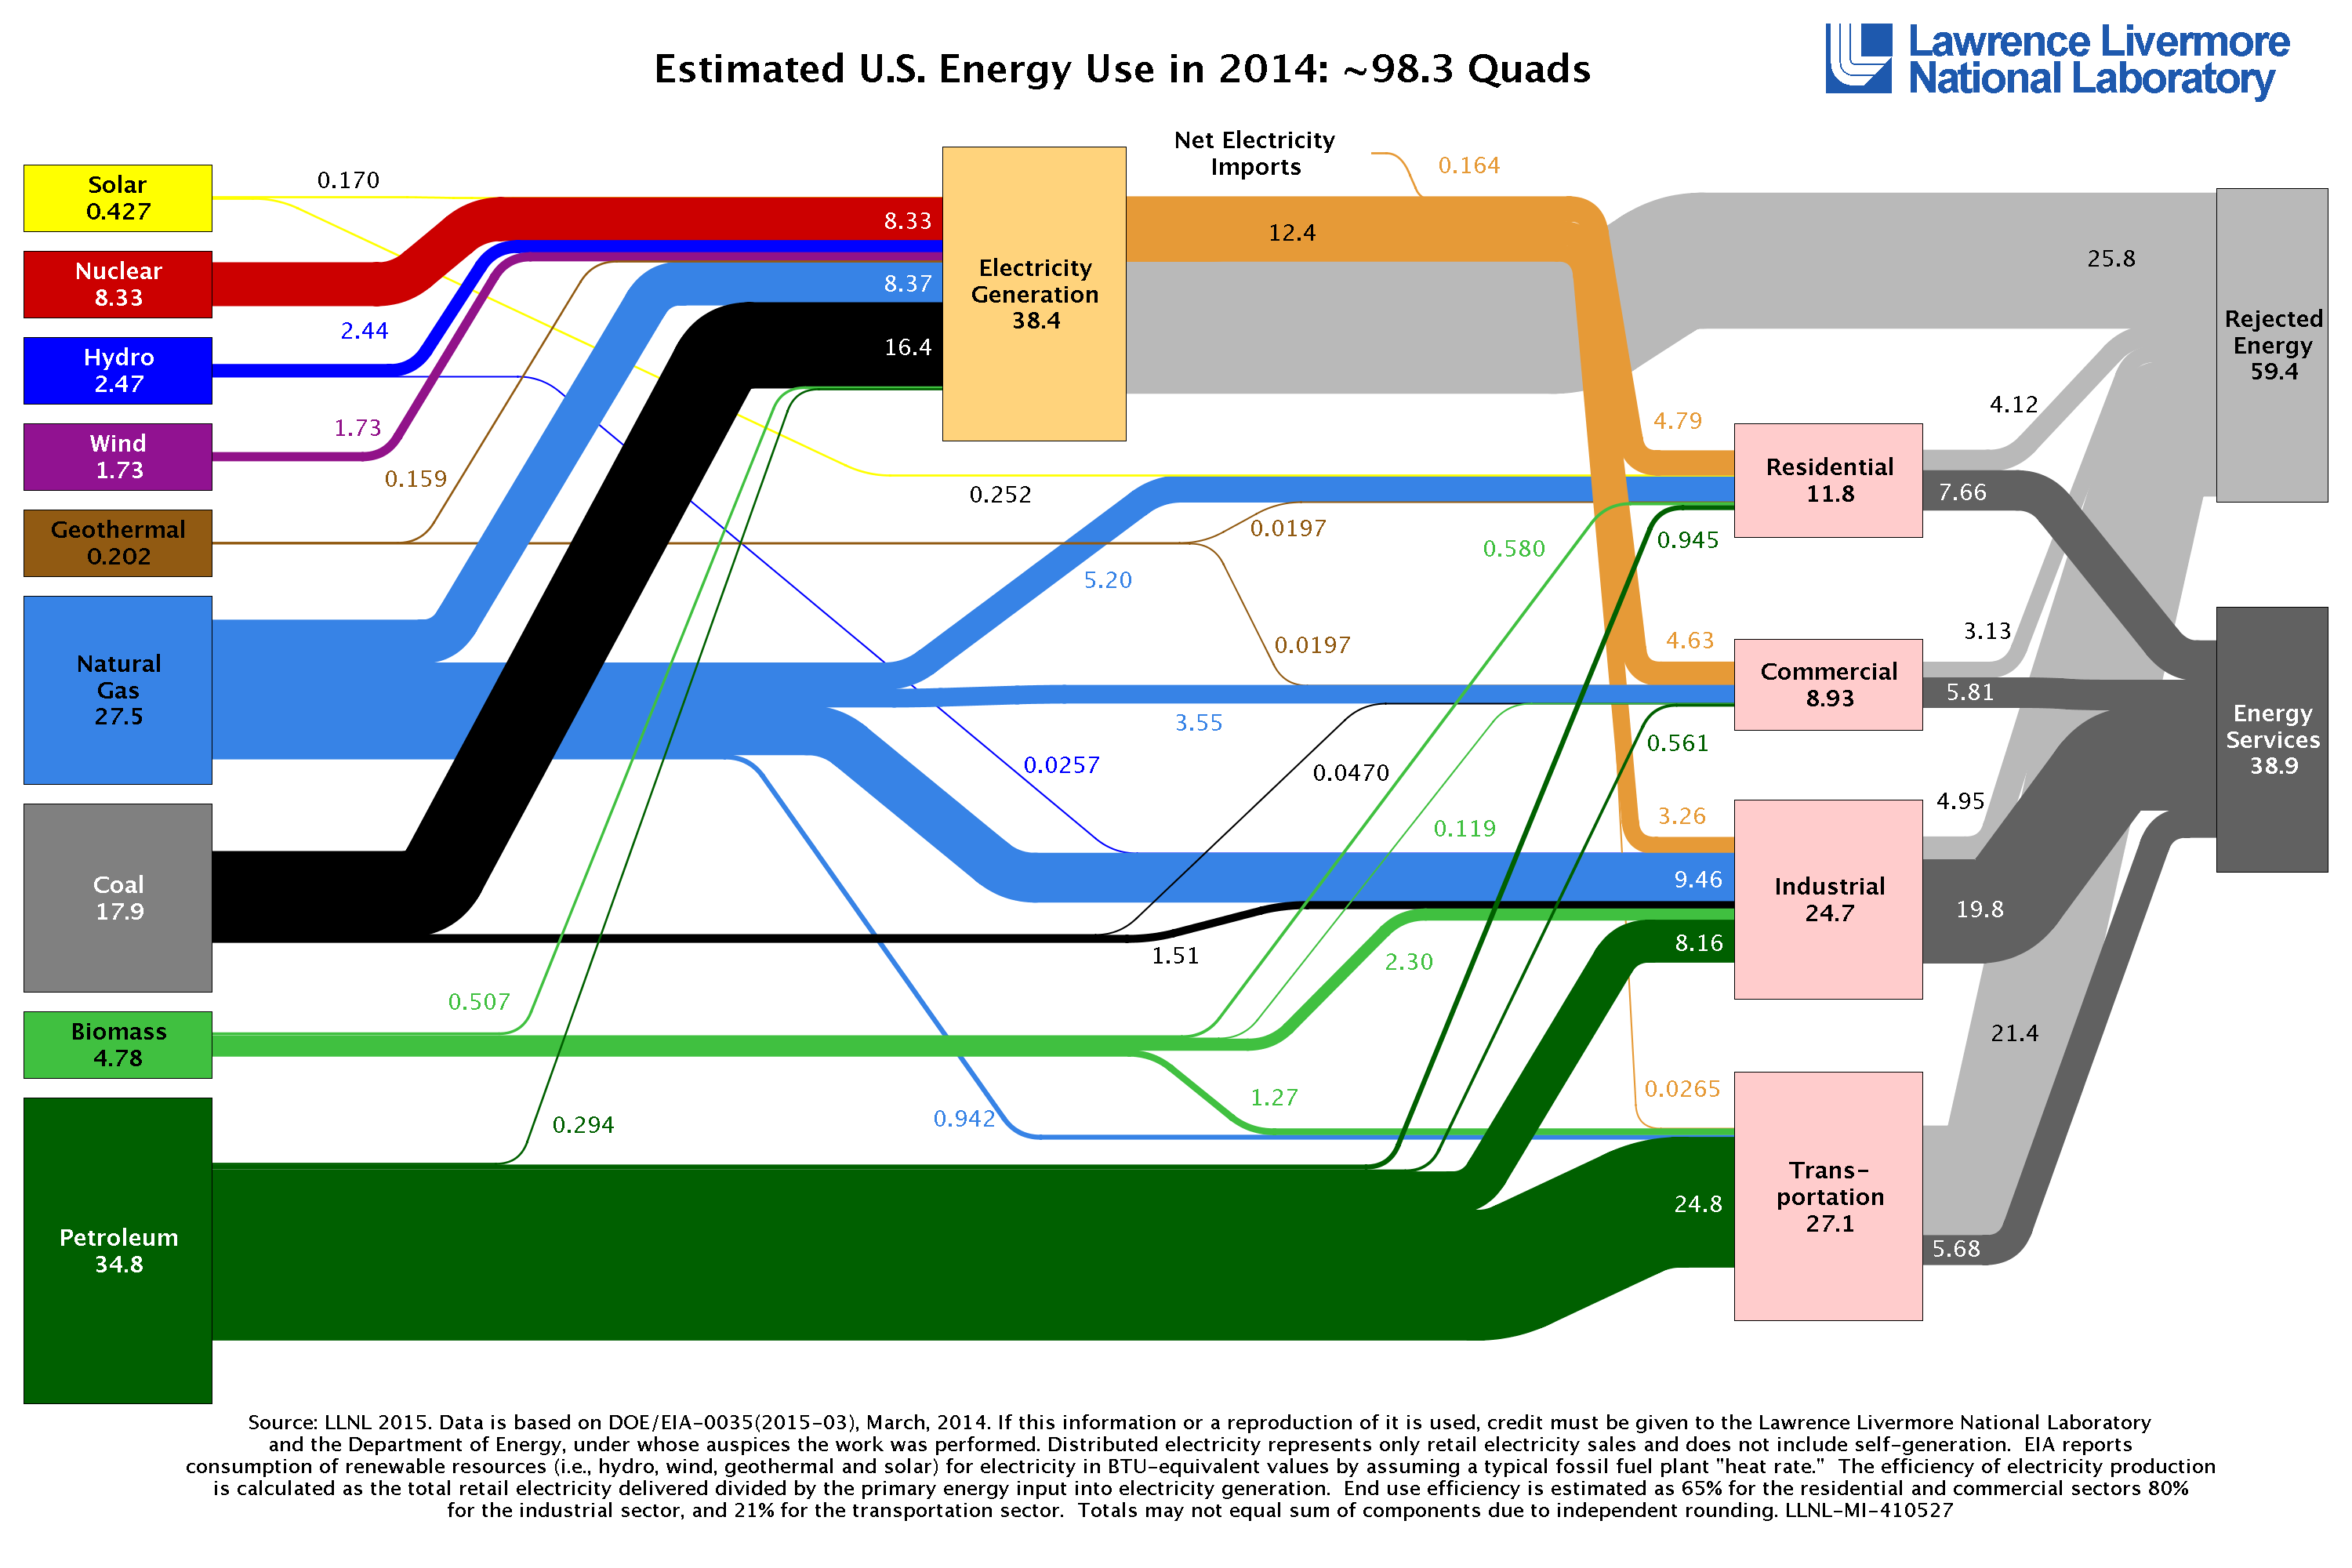
Americans’ energy use continued to grow slowly in 2014, according to the most recent energy flow charts (Sankey) released by Lawrence Livermore National Laboratory (LLNL). Overall, Americans’ 2014 energy use increased slightly by ~1% on 2013 figures. This increase is driven primarily by the expansion of the domestic natural gas, wind and solar energy sectors.
The 2014 energy flow chart (Sankey) below, released by Lawrence Livermore National Laboratory, details the sources of energy production, how Americans are using energy and how much waste exists.
Petroleum use was decreased by 1 % due mainly to lower use in the industrial sector. Much of that energy has been replaced by natural gas. Solar energy use jumped dramatically by 33 % and wind energy was also up by 8 %. However, not all of the news for renewable energy sector was positive, hydroelectricity production declined by almost 4 % due to the continued drought in California. Additionally, the rejected energy (i.e. the unharvested energy from inefficient production sources, such as the heat you feel when you put your hand on your water heater and the warm exhaust from your car’s tailpipe) increased in 2014, rising in proportion to the total energy consumed.
The majority of energy use in 2014 was used for electricity generation, followed by transportation, industrial, residential, and commercial.
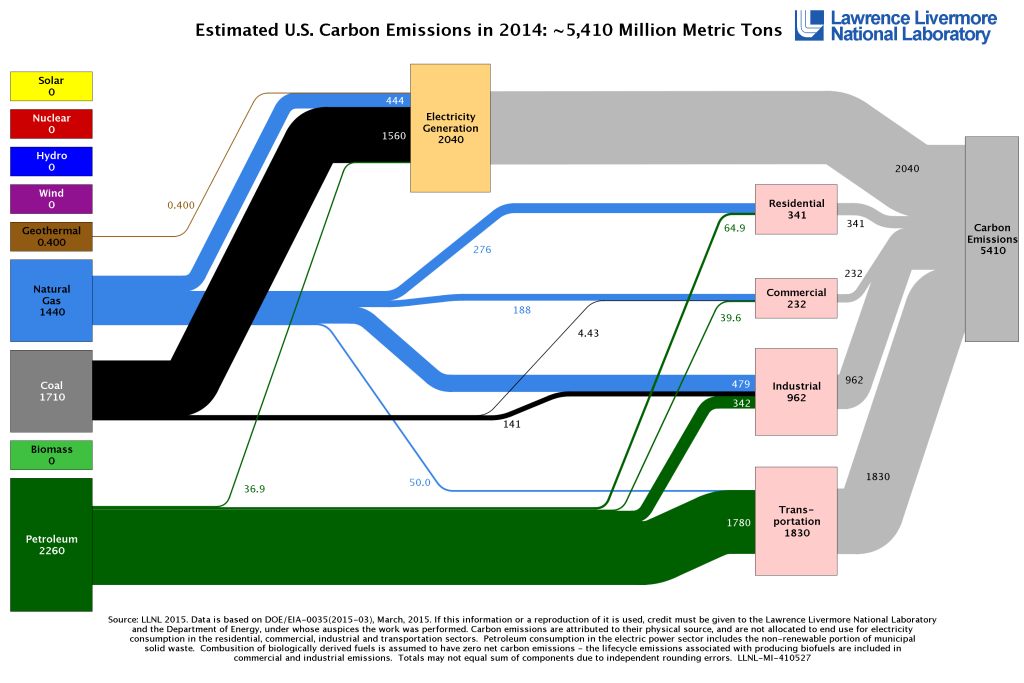
The Laboratory also released a companion chart illustrating the nation’s energy-related carbon dioxide (CO2) emissions (see figure below). Americans’ CO2 emissions increased slightly, by ~0.4% in 2014. However, CO2 emissions from coal and petroleum declined. Overall, the news is positive; the carbon intensity of the American energy economy is decreasing.
Reference: Lawrence Livermore National Laboratory press release May 20, 2015: American energy use up slightly, carbon emissions almost unchanged.

