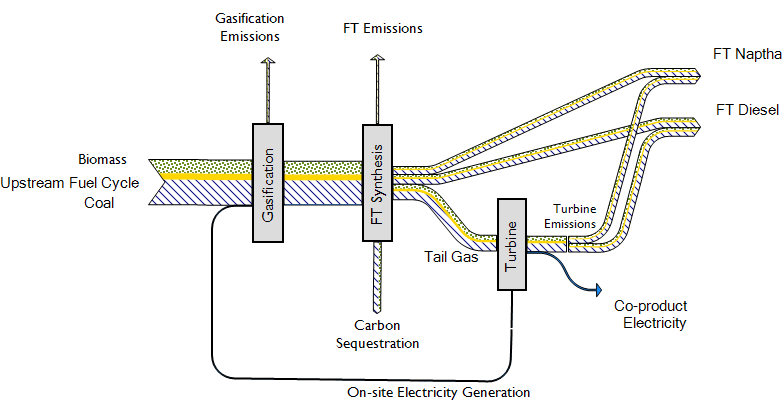
Life Cycle Associates uses a variety of techniques to track the energy inputs and emissions associated with fuel production processes. Identifying the energy flows within a process is a key to understanding the life cycle impacts of a process. A Sankey diagram illustrates the flows within a process of energy, mass, carbon, cost, or any other flow of importance. The life cycle of inputs can therefore be distributed throughout a process based on allocation of flows.
Do you have questions about energy analysis and how we can apply it to your process?