- February 17, 2015
- Posted by: Life Cycle Associates
- Category: LCFS
Life Cycle Associates submitted the following comment for the February 19, 2015 Board Hearing to consider the re-adoption of a revised Low Carbon Fuel Standard:
Life Cycle Associates would like to take this opportunity to provide comments and insight to the recently released California GREET2.0 model. The comments herein address the analysis and treatment of N2O emissions from soybean farming and time impacts on biofuel pathways. These comments are a continuation of comments submitted on 10/28/2014 addressing the same issue, which has not been addressed in the new release. CA_GREET2.0 estimates the releases of N2O due to fertilizer application, crop residue, volatilization, and the secondary effects from leaching as per the IPCC methods. GREET does not include emissions from nitrogen fixation in legumes. The emissions from the nitrogen fixed in the plants are a major contributor to lifecycle greenhouse gas emissions from soybeans, which affects soy bio- and renewable diesel pathways as well as co-product credits for other pathways. Table 1 shows the impacts of addressing N2O fixation on the CA_GREET2.0 soy biodiesel and corn ethanol fuel pathways. The effect of the N fixation on the corn ethanol pathway is due to the higher DGS co-product credit obtained for displacing the higher emissions soybean meal animal feed.
Table 1. N2O fixation Impact on corn ethanol and soy biodiesel fuel pathways.

GHG Impacts of Nitrogen Fixation in Legumes
The emissions from soybean production have been examined in many fuel LCA models and the latest research from the JRC’s GNOC model as well as other studies shows that the emissions from nitrogen fixation are significant. The effect is well described by Venkat, 2010:
“IPCC (2006) does not include biological nitrogen fixation as a direct source of N2O, instead relying solely on the nitrogen inputs from crop residues (above and below ground) to account for all legume N2O emissions. The problem with this is that the IPCC crop residue model does not seem to capture the magnitude of N2O emissions in the late-growth stages of soybeans (this is the one crop that I have looked at in detail; others may have a similar problem). There is in fact almost an order of magnitude difference between the worst-case (high) N2O emissions from crop residue and the conservative (low) N2O emissions in the late-growth stages (crop residue emissions are smaller by a factor of 5 to 10).”
These comments address the N2O release from soybean farming in GREET and CA_GREET2.0 and compare the results to the EPA RIA analysis, the EU GNOC (Global Nitrous Oxide Calculator) and the 2013 JRC WTT report. Results from these studies suggest that the GREET inputs underestimate the N2O emissions from soybean production, which affects soy biodiesel, renewable diesel, and corn ethanol pathways with soy displacing corn. Figure 1 shows the N2O contribution to the total GHG emissions of the finished fuel produced, based on data from GREET and the various leading studies addressed in these comments.
ARB should evaluate these studies and re-examine the GREET methodology and values to ensure that the treatment of corn and soy is commensurate to the N2O emissions generated.
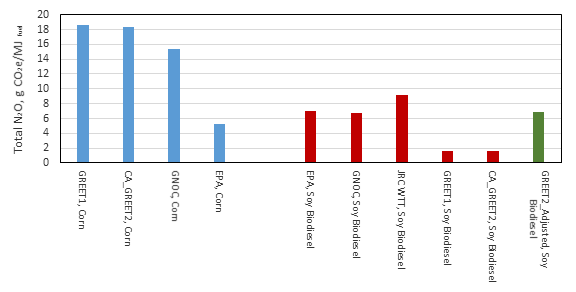 Figure 1. N2O contribution to GHG emissions from corn and soy crops.
a Emissions are calculated from GREET data and data in the EU and EPA studies, crop yields are based on 2014 NASS data for corn and soy.
EPA RIA N2O Emissions Analysis
The EPA evaluated the nitrous oxide emissions for soy and corn biomass as part of the RIA analysis (EPA, 2013). Figure 2 shows the N2O emissions from bioenergy crops in the U.S as presented in the EPA RIA. The N2O emissions attributed to the crop residue and leaching from soy and corn bioenergy crops account for approximately 40% and 25% of the total N2O emissions.
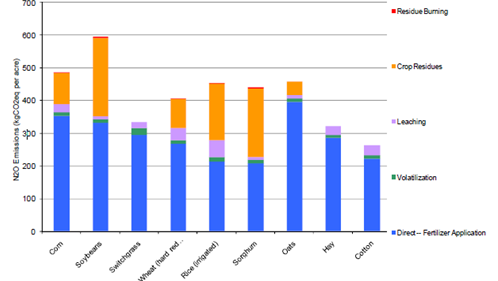 Figure 2. EPA RIA N2O emissions form bioenergy crops
Table 2 shows the N2O emissions from the biomass fixation and leaching and also the contribution of these emissions to the total GHG emissions of the finished fuel produced, based on the EPA RIA. NASS average crop yields for 2014 is assumed for calculation of the total N2O emissions (kg/ha).
Table 2. EPA RIA Nitrous Oxide Emissions from Soybean and Corn Farming

JRC GNOC N2O Emissions Analysis
The European JRC GNOC (Global Nitrous Oxide Calculator) (Köble, 2014) calculates N2O emissions based on the 2006 IPCC guidelines (Eggleston, 2006) combining TIER1 and TIER2. The IPCC guidelines distinguishes different pathways (direct, indirect) and different nitrogen sources (e.g. mineral fertilizer, manure, crop residues, and drained organic soils). For the indirect pathways (leaching/runoff and volatilization) the GNOC follows the IPCC TIER1 approach for all nitrogen sources. The same holds for direct emissions from crop residues and drained organic soils.
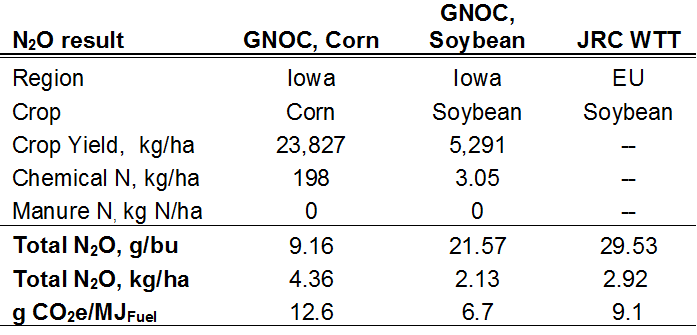
Table 3 shows the GNOC and the JRC WTT study (CONCAWE, 2013) N2O emissions from soy and corn farming and also the contribution of these emissions to the total GHG emissions of the finished fuel produced.
Table 3. JRC GNOC Nitrous Oxide Emissions from Soybean and Corn Farming
GREET N2O Emissions Analysis
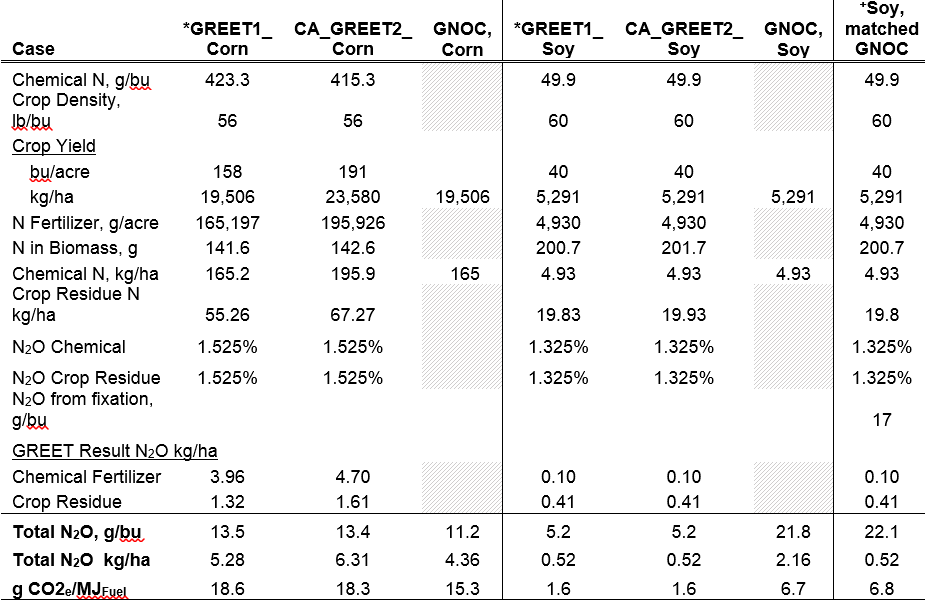
Table 4 shows the GREET N2O emissions from soybean and corn farming and the contribution of these emissions to the total GHG emissions of the finished fuel produced. Table 4 also shows the GREET2 soybean results if a constant for N fixation in the biomass consistent with the GNOC results was applied. A constant for the corn analysis can also be applied (not shown here).
GREET does not include biological nitrogen fixation as a direct source of N2O, instead relying on the nitrogen inputs from crop residues to account for total N2O emissions. As previously stated by Venkat, 2010, this analysis does not accurately capture the magnitude of N2O emissions in the late-growth stages of soybeans. The omission of nitrogen fixation leads to a misrepresentation of the total GHG emissions from soybeans and affects the soy biofuel pathways and other pathways where soybean meal is a substitute co-product.
Table 4. N2O emissions from soybean and corn pathways.
*GREET1 cases are determined using GREET1_2014.
+ Soy matched to GNOC include N2O from legume fixation.
Figure 3 shows a graphical comparison of the GREET N2O emissions (g/ha) versus the leading studies identified here. The GREET Soybean N2O emissions (kg/ha) are ~ 5 times lower than the other leading studies.
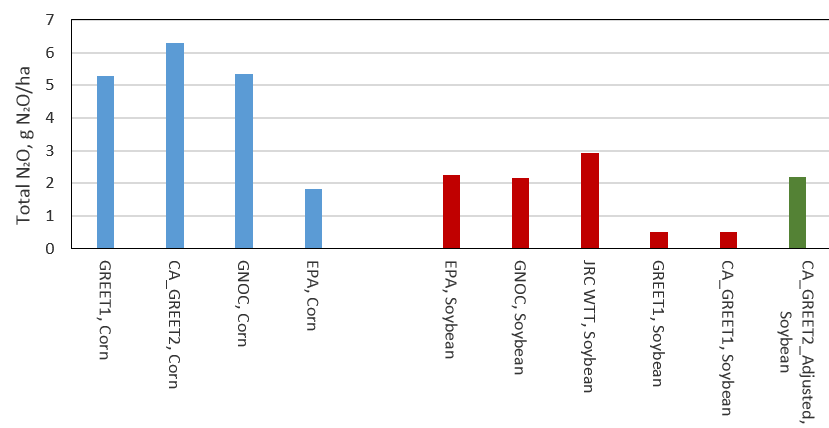 Figure 3. Total N2O emissions from corn and soybean production.
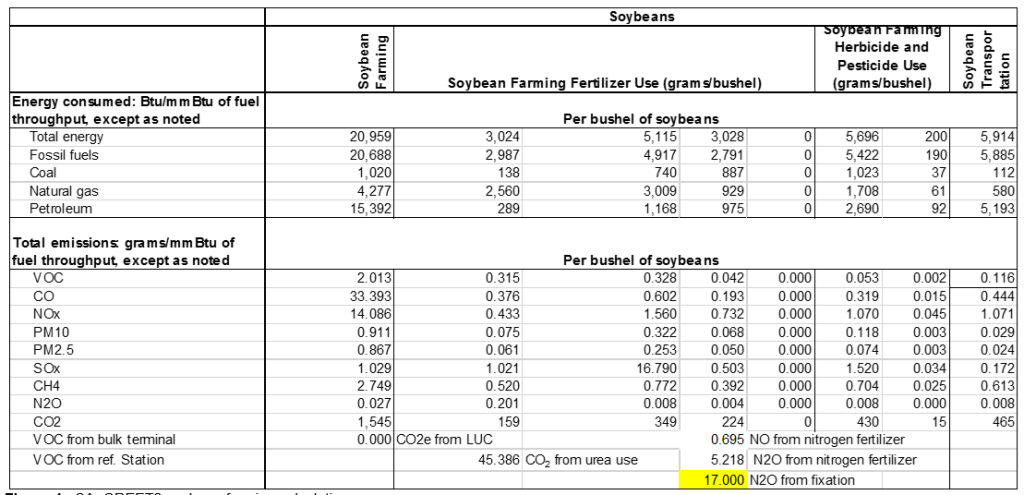
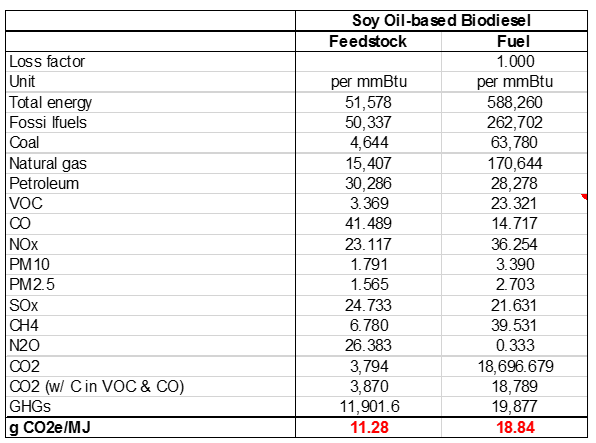
Figure 4 shows the CA_GREET2 calculation array for soybean farming. An additional term to account for the N2O from biomass fixation has been added (highlighted in yellow). The WTT results array for the CA_GREET2 adjusted case is shown in Figure 5.
Figure 4. CA_GREET2 soybean farming calculation array.
Figure 5. CA_GREET2 soybean biodiesel WTT results array.
We hope that these comments have illustrated that the N2O emissions in GREET are in need of thorough evaluation. Thank you for taking into account these comments. I look forward to discussing these comments with you in more detail.
1 Comment
Comments are closed.

[…] Cycle Associates submitted two comments. One comment addresses the Treatment of Nitrogen Fixation in Soybeans and the second one discusses the Electricity Mix in CA […]